Impedance-based flow cytometry
JAN 2015 - JUL 2017
JAN 2015 - JUL 2017
My principal work at National Taiwan University following with Dr. Chih-Ting Lin, is dealing with the microfluidics novel device based on impedance sensing method to detect cell or particle charateristics. Circular tumor cells are vital targets we wish to differentiate inside the anomalous blood. Coplanar electrodes are deposited and tend to sense the impedance difference with cell penetration.
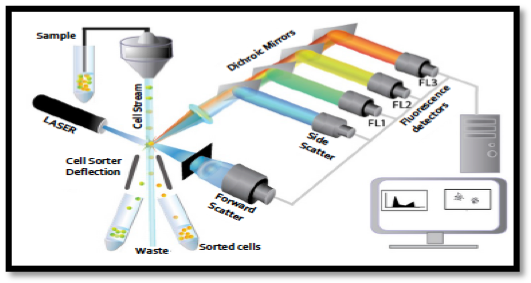
Recently, the develop of flow cytometry provides a convenient, fast and accurate way to discover cell properties. The most common detection way used in flow cytometry is the optical method, projecting a laser beam on the target cell and then analyzing the fluoresence. However, although this kind of optical method is accurate, the equipment is bulky, needs a careful alignment, requires labeling for detection. These disadvantages are the constraints when we want to develop a portable device to realize lab-on-chip and easy to use.
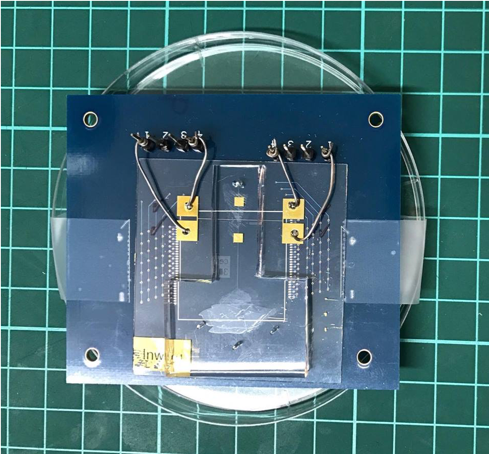
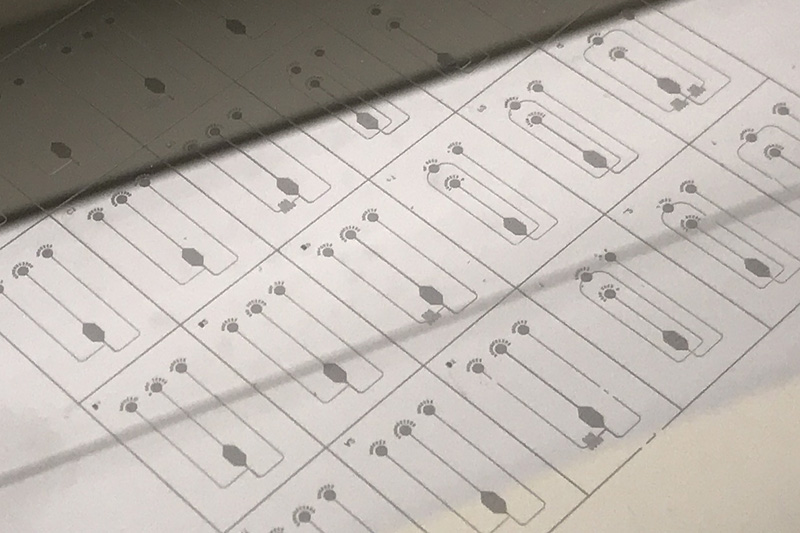
A designed microfluidic channel is bounded on a Co-planar electrode-deposited substrate. Cells or particles are injected in channels to penetrate through applied electric field within channels and cause impedance difference. All the electrodes are fabricated on the same plane rather than the parallel electrodes fabricated electrodes face-to-face. Four electrodes are used as a sensing electrode set, so multiple signals can be obtained from different electrode at the same time. We used standard soft-lithography process to build up the applications.
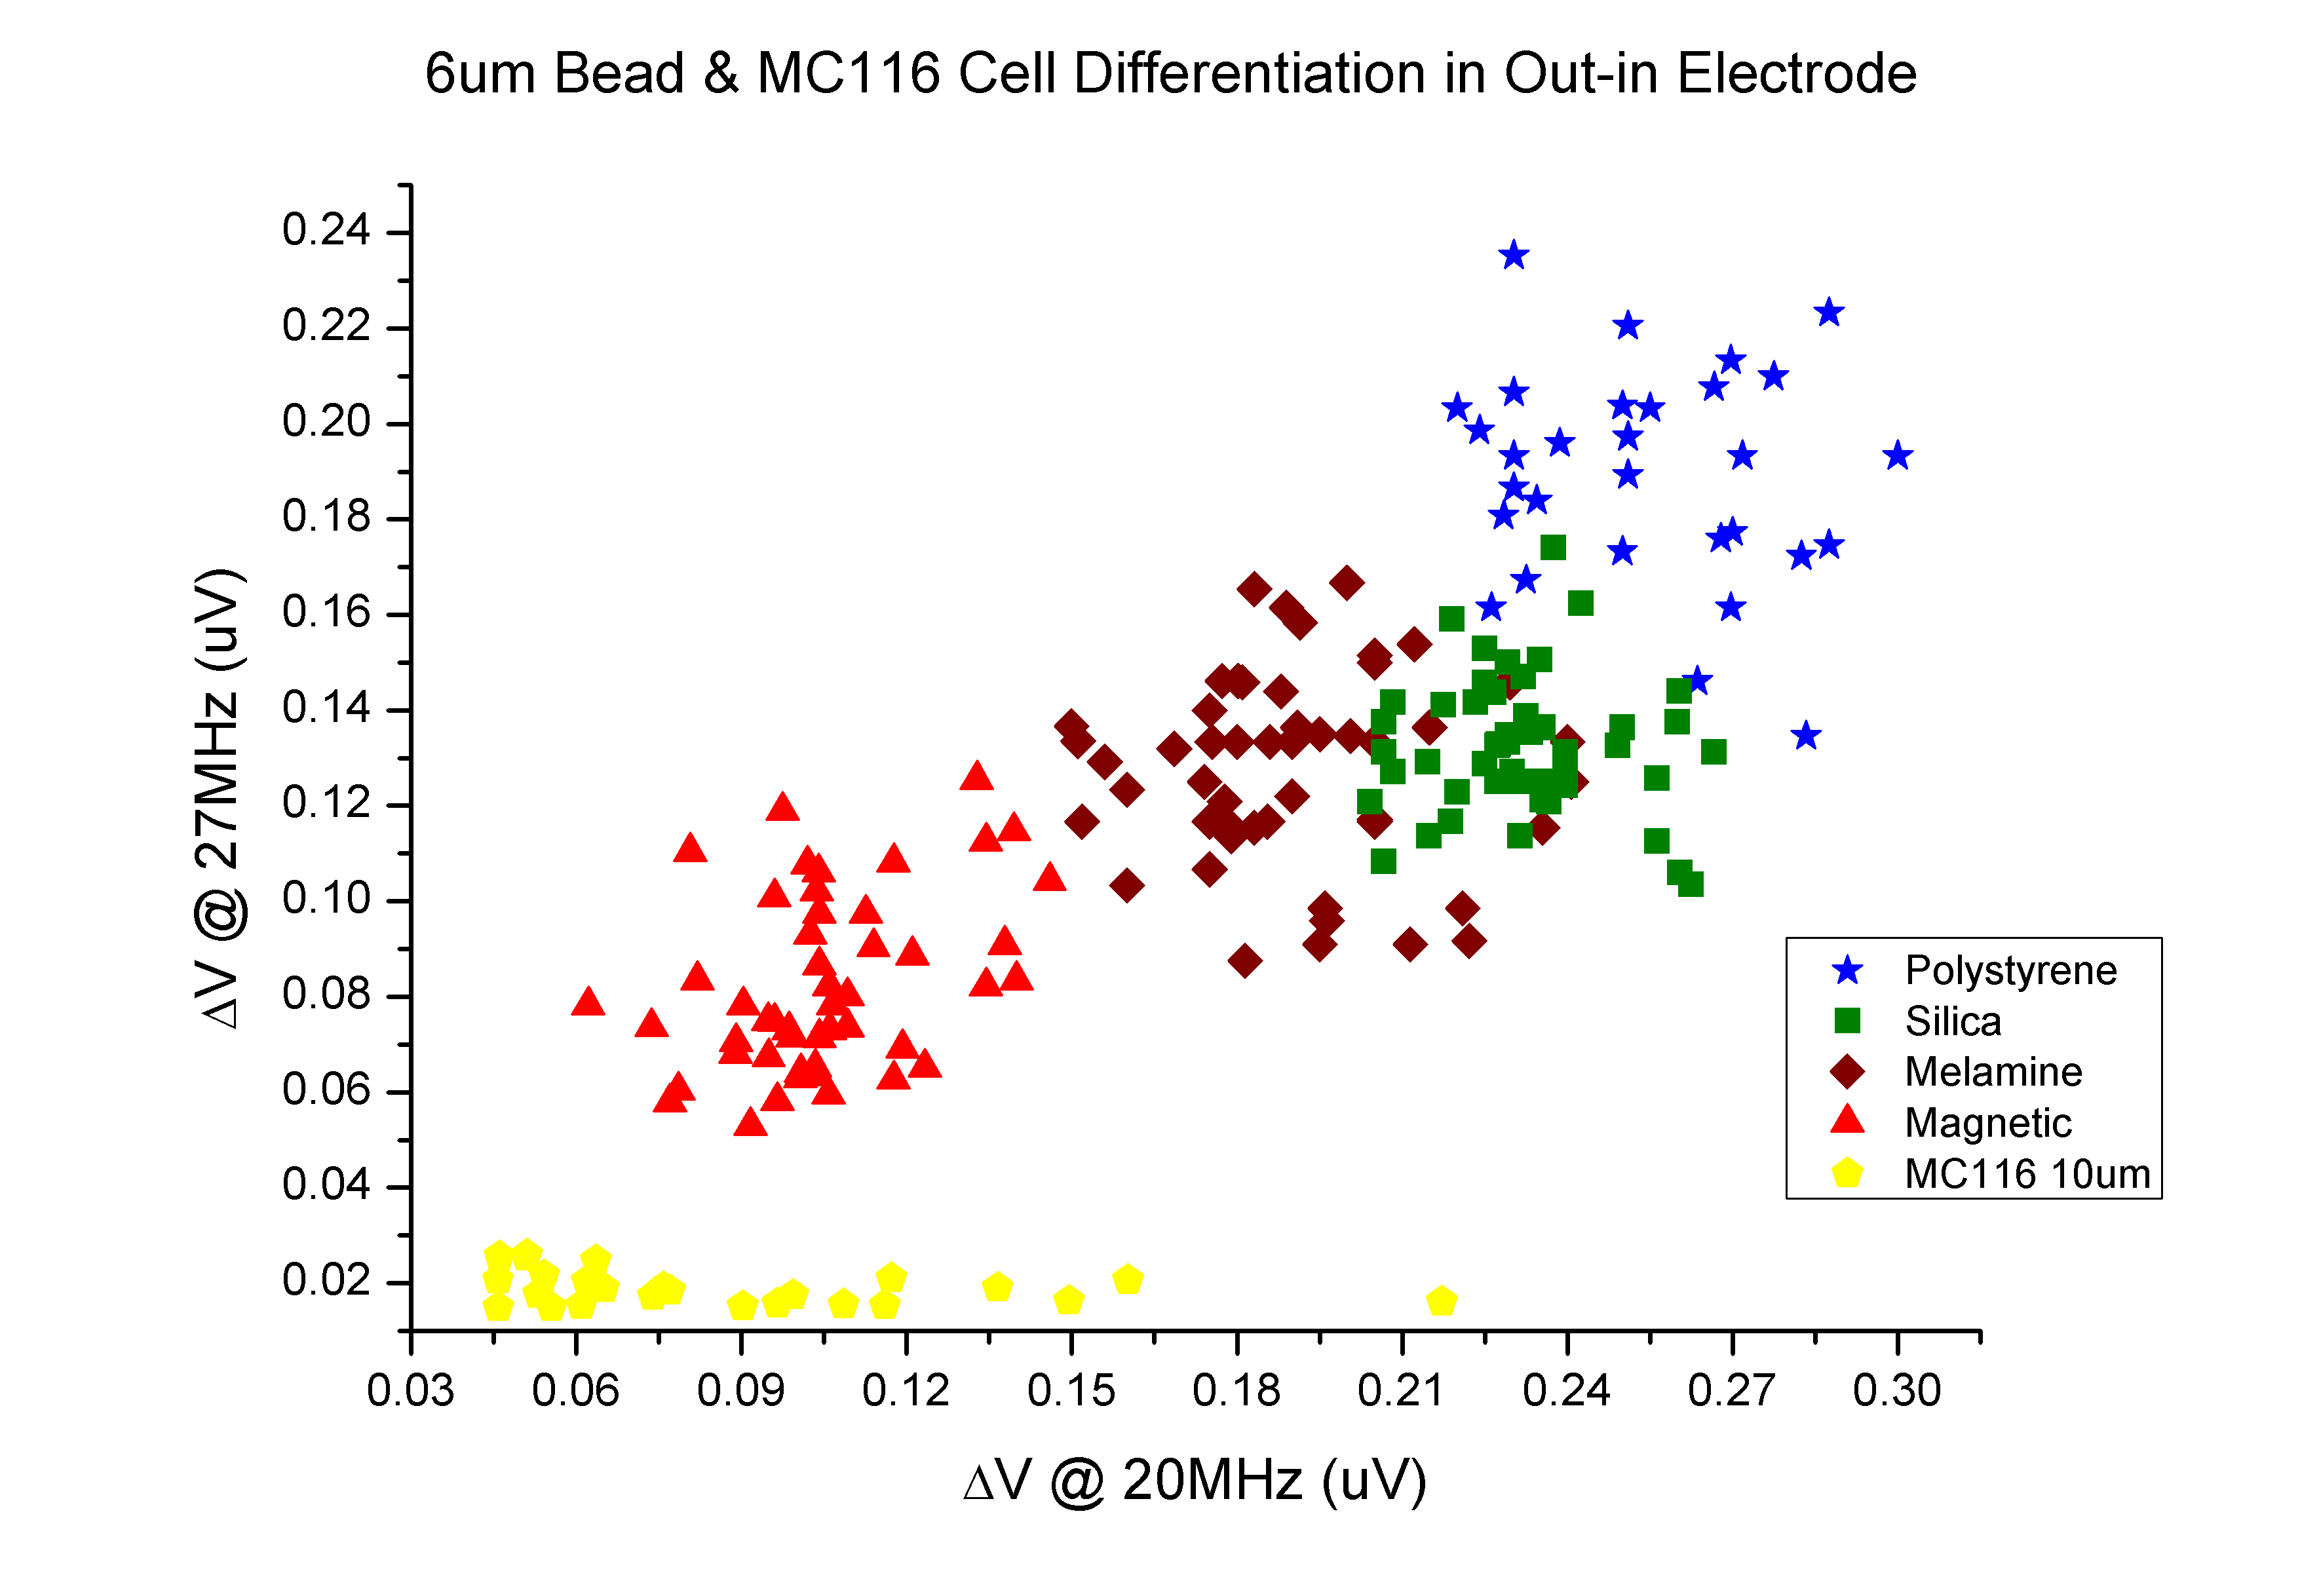
The main contributions for the research include three major milestones: 1) We discovered the device substrate effect on the extension of ac operational frequency ranges. For higher frequency applied, we could extract more information from tested particles. 2) The electrode spatial design also affects the sensitivity and effectiveness of the device. 3) By using the proposed device with higher frequency ac signal applied, we were able to distinguish the particle types and its surface modifications.
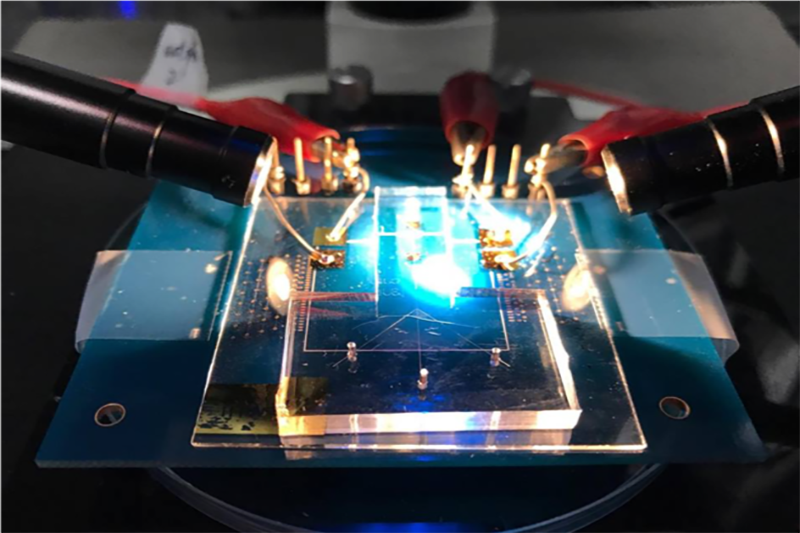
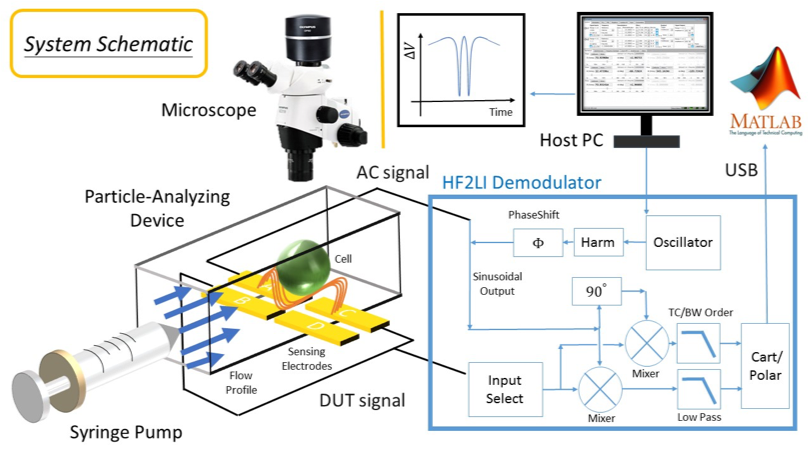
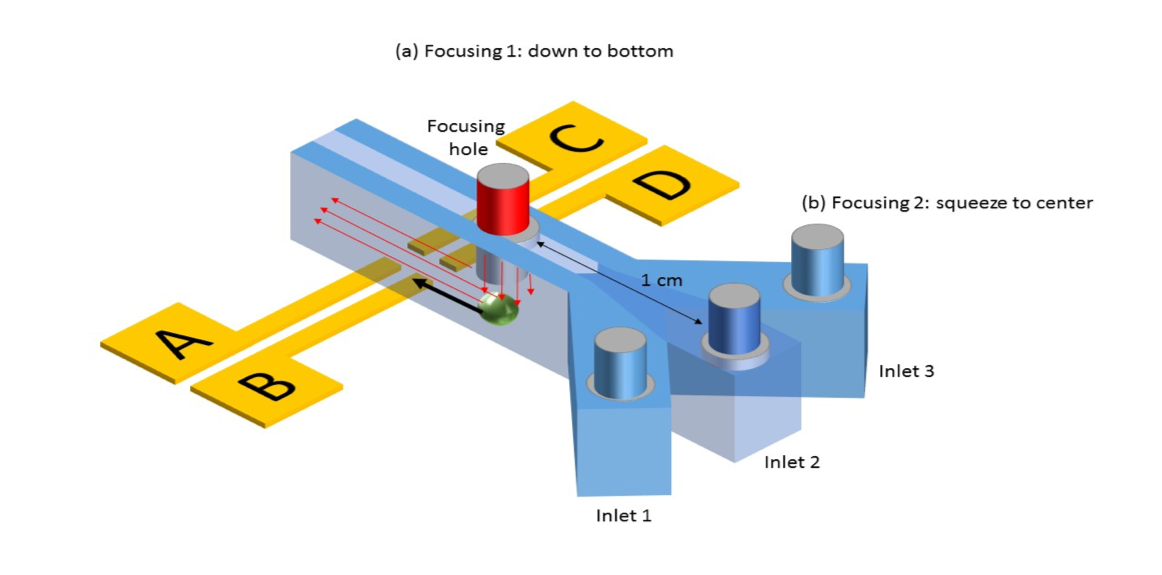
The experiment setup is shown in Figure 1. Lock in amplifier (Zurich instrument, HF2LI) is used to
supply the
voltage and measure the electric signal. Then, the data was transported to the personal computer. MATLAB was
utilized to read out the data and plot the data. The beads movement is also observed by the CCD camera.
For signal response sensing, an AC voltage of 1 volt and 1M Hz is applied on the electrode which is
labeled as
“A” as Figure 2 shows. (The choice considerations are talked in the sub-section, Method and Experiment
Parameter.) Then, electrical signals are measured from electrode labeled as “B” and “C” simultaneously when
beads flow through the sensing area. Signal measured from electrode “B” is call the “Neighbor Signal”, while
signal from electrode “C” is called the “Across Signal” in this thesis. By measuring this two kinds of
signals, the information of bead position (flow path) and size can be derived.
As showed in Figure 2, there are three kinds of flow path discussed in this thesis, namely, close
path,
center
path and far path. In order to control the flow path of beads, the KCL solution with beads inside is
injected
into the microfluidics channel from inlet 1, inlet 2, inlet 3, respectively. When the solution is injected
from inlet 1, the flow path of beads will be close to electrode “C” and “D”, namely the far path because of
the inertia of moving objects. Similarly, the beads injected from inlet 3 will flow through the close path
in
Figure 21. If we want the beads flow along the center path, just inject the solution from inlet 2. Hence,
injected from different inlet, beads will flow on either paths.
Here we present our results including differentiation tasks, frequency-depenpent anlaysis including stray capacitance effect and electrode spatial design. The following table is some preparation and experimental parameters setup.
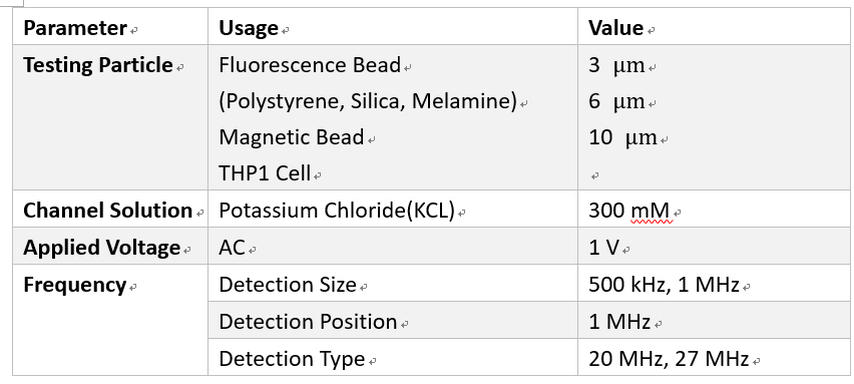
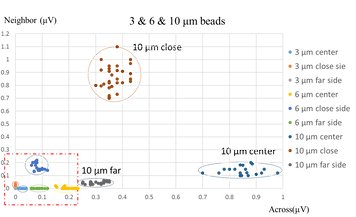
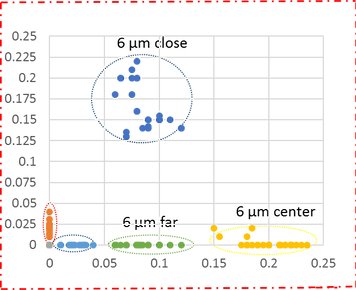
For the first task, we successfully differentiate 3 sizes of polystyrene beads with different positions inside the channel. By analyzing the abrupt increase of impedance resulting significant drop of voltage, we could use lock-in amplifier to demultiply the signal responses with reference signals. Then we use matlab to perform signal processing and obtain the frequency response at 1MHz applied signal. From the obvious clusters shown in figure with different beads' positions and sizes, this set of sensing electrode is capable of tell the unknown bead size and unknown position simultaneously.
Since we have demonstrated the device's capability of differentiating particles' size and position in standardized 1MHz signal excitation, frequency variation shall be next particularly discussed with its influence on signal response as overall impedance varies, and further application of differentiating disparate types of particles. In order to characterize the parasitic behavior and determine the optimal regime for device operation, a proposed model is established to simulate the channel environment so to calculate the impedance variation and correspondent signal response.
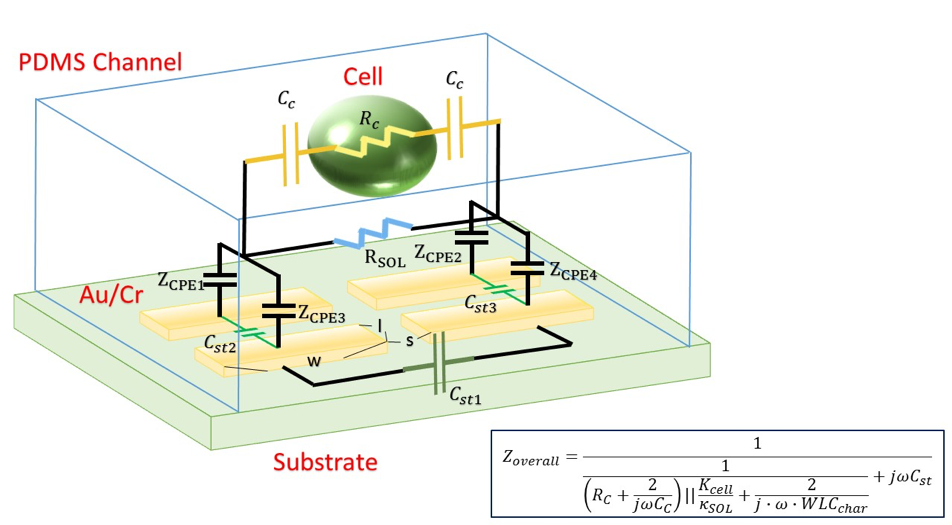
As simulated in model, a frequency pattern is theoretically characterized:
(1) At frequencies below 100 kHz, the impedance is mostly dominated by the capacitance of the insulator layer (electrical double layer sandwiched between the electrode and buffer solution).
(2) At frequencies between 100 kHz and 1 MHz, the impedance is dominated by the bulk solution resistance across the electrolyte. This regime is optimal for measuring the impedance of cells or beads passing across the channel.
(3) At frequencies above 1 MHz, again we see a drop in impedance with frequency. This region is dominated by parasitic or device intrinsic capacitance. Such capacitance and resistance domains are determined by the buffer conductivity[1].
Then, 20um electrodes on glass substrate are both experimented with different KCL solution circumstances and no beads penetration. Impedance pattern would be indicated as we have done impedance analyzing in Agilent 4294A precision impedance analyzer in Figure. 6 and corresponds to baseline of signal response. Next, real experiments of impedance change when 6um bead penetration in Figure. 7 are used to verify the frequency spectrum in Figure. 6. An optimal frequency range is found and set with Figure. 6 and Figure. 7. which we could correspond back to the proposed model.
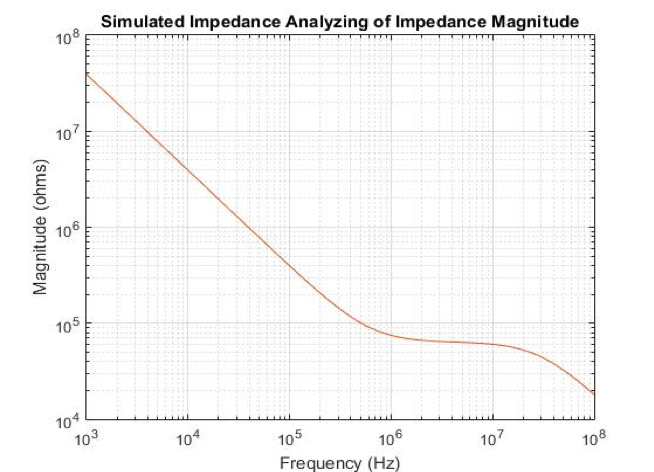
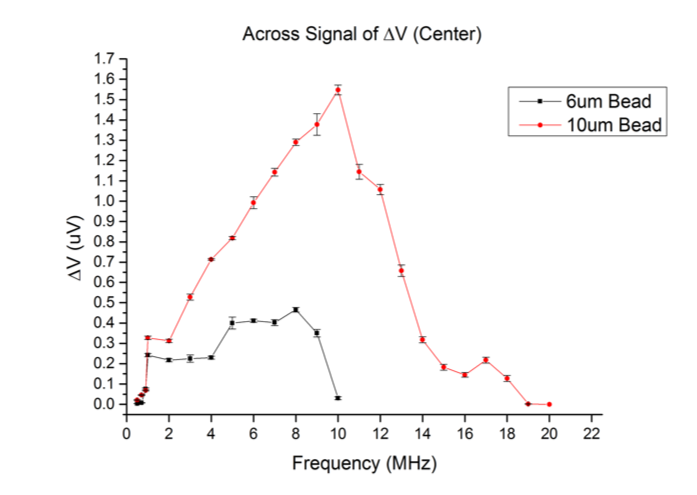
As we could see in the figure 1., Around 1MHz to 10MHz, there is a flat region where channel resistance dominates the whole measured impedance, indicating the relative obvious signal change as we can detect when bead penetrates on the sensing electrode pairs. In figure 2, due to device characteristics, there are two signal curves representing 6 um and 10 um bead responses. Non ideal capacitive effects clearly create a limited frequency range for operational frequency. These ranges (1-10 MHz for 6 um bead and 1-15 MHz for 10 um bead) define our frequency usage to successfully differentiate bead properties. To go in depth, when the frequency goes high, the response gets higher as double layer impedance takes up less effect. But after 8 MHz (6 um) and 12 MHz (10 um), parasitic effect starts to devastate the detection of response as an issue we would like to deal with in next session.
[1] Reference by Sam Emaminejad, Kee-Hyun Paik, Vincent Tabard-Cossa, Mehdi Javanmar, stanford, CA " Portable cytometry using microscale electronic sensing" Sensors and Actuators B: Chemical, 2 September 2015